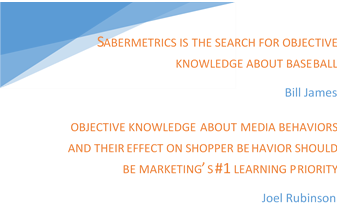
Moneyball is the story of how the Oakland A’s competed effectively with large market baseball teams despite having less than half of the budget for player salaries. That is just the plot. The moral of the story has to do with organizational blindspots that come about from the way things are always done and how evidence based on objective statistical analysis can create a whole new picture of how to achieve success. The branch of applied statistics in baseball analysis is called Sabermetrics.
I want to pay this off to changes that are needed in marketing and marketing research, but first a bit of personal background.
I love what I do for a living, but my love of baseball came first.
Although I was very young, I vaguely remember Mickey Mantle’s triple crown year (tops in home runs, batting average, and runs batted in), and even pushing my parents to take me to Ebbets Field before the Dodgers abandoned Brooklyn. Even when I argued with my father, we always could reconcile by talking baseball.
Baseball is so rich in statistics because a game is made up of discrete events (pitches), over a season played daily for 162 games, across 25 players on each of (now) 30 teams. I wonder if my love of baseball led to my love of statistics and modeling rather than the other way around.
In high school, my love of math and baseball started to converge when I discovered Strat-O-Matic baseball. It claimed to be the most realistic baseball game on the market and I had to know…I created 8 teams with different themes, and spent a whole summer playing a full season, and keeping stats (this was before calculators!). It was, in fact, highly accurate!
In grad school at the University of Chicago in the 70s, I took an independent studies course in regression methods. The term paper topic I chose was on predicting baseball team winning percentage as a function of hitting, pitching, and fielding performance.
I remember two clear findings…
· “On base Percentage” was more important than batting average
· After I finalized the model, I conducted simulations that demonstrated Mickey Mantle was worth 4 more wins in a season than Sandy Koufax by substituting average player stats for their stats into the regression model.
I guess I was the first Sabermetrician!!
Over the past 3 ½ years as a consultant, I’ve been working at Moneyballing marketing and marketing research. For example, I have created measurable models of brand success that combine organically occurring digital and social data with very lean survey approaches to brand tracking. The data streams are prepped for brand KPI reporting and for marketing mix style modeling. I have found that clients should place more priority on improved targeting of paid messages and on owned media. I found that organic impressions in a Facebook newsfeed do little for a brand unless it drives visits to the brand page. I found that brand to consumer connections are not a general thing, but a moment by moment thing that provides context which drives shopper choices. Perhaps brand equity should be thought of as the sum of relevance for each moment? Perhaps that makes mobile research much more important?
Using Moneyball as a metaphor, I created a chart that draws the analogy between Moneyball-ing baseball vs. Moneyball-ing marketing and marketing research.
I hope you find it eye-opening, a blindspot remover, and leads you to challenge current practice.

