

Now updated with technical write-up here.
Brand switching reports are not standard for frequent shopper data, location data or receipt scanning providers, but they can produce them upon request. Brand trackers usually don’t ask the needed questions to generate it…but they could. And you should ask for it because it might become the most powerful tool in your analytic arsenal.
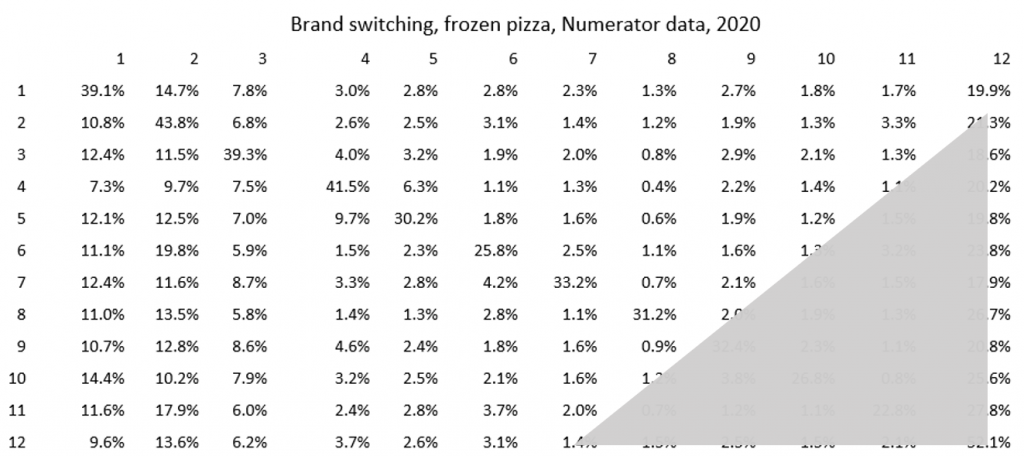
A brand switching matrix is basically just a crosstab of pairs of purchases. It also has all the properties of a Markov transition matrix which opens up a world of mathematical possibilities.
Just by knowing the matrix, you can get to:
- Equilibrium market shares. What market shares are each brand headed towards? Which brands are poised for growth or decline? (Repeat rates on the diagonal of the matrix are the most important factors.)
- Competitive frame. What are the competitive sets? Who is a brand gaining from or losing to?
- Category loyalty. Do consumers see much brand differentiation?
- Movable Middle sizing. Know the segment you want to target for maximum ROAS
- New brand projections. Predict the share a new brand is headed towards based on its emerging repeat rate
- Brand Penetration estimation. This is the one that blows me away…without knowing market shares or anything other than category purchase cycle, you can predict penetration from the switching matrix for each brand with uncanny accuracy.
Numerator receipt scanning data on frozen pizza was used as my sandbox. Consider the switching matrix I created (shown above). I focused on 11 major brands and then created an “all other” category.
Calculating equilibrium market shares. Because a switching matrix is a Markov matrix, one can calculate eigenvalues and eigenvectors. There is always one eigenvalue equal to 1 and the associated eigenvector tells you the steady state market share that each brand is headed towards. (The other eigenvalues are smaller, as per the Perron-Frobenius theorem). We see here how close actual and predicted shares are for pizza. Remember these predicted shares just come from the switching matrix’ main eigenvector! No purchase intent questions, time series, or penetration inputs!
| brand | actual share | eigen share |
| 1 | 14.8% | 14.8% |
| 2 | 19.0% | 19.3% |
| 3 | 10.1% | 10.2% |
| 4 | 5.6% | 5.7% |
| 5 | 4.0% | 4.0% |
| 6 | 3.6% | 3.5% |
| 7 | 2.5% | 2.5% |
| 8 | 1.7% | 1.7% |
| 9 | 3.4% | 3.4% |
| 10 | 2.1% | 2.1% |
| 11 | 2.6% | 2.6% |
| 12 | 30.6% | 30.4% |
Predicting all brands’ penetration levels. I never thought this would work so well, but wow! For this approach, in addition to the Markov Matrix, you only need the category purchase cycle. You do NOT need market share or any other inputs! Here’s why it works:
First, note that a brand switching matrix contains all non-zero values which means that a consumer has a non-zero probability of “random walks” from any brand to any other brand (property of “Ergodicity”). Linear algebra methods let you compute the average “waiting time” for competitive brands to “send” consumers to your brand, via something called the Fundamental Matrix (even though the brand of interest is not an absorbing state Ben Lipstein in a paper in 1962 showed this was not a problem). Then, with half-life math, you can predict the build in brand penetration. Here is how close I came on pizza.
Predicted vs. actual: 10-month cumulative penetration, Frozen pizza (Numerator data)
| Brand | Predicted | Actual |
| 1 | 41.5% | 37.9% |
| 2 | 45.1% | 39.7% |
| 3 | 28.4% | 29.9% |
| 4 | 15.2% | 14.5% |
| 5 | 12.9% | 13.5% |
| 6 | 13.5% | 14.5% |
| 7 | 7.8% | 8.5% |
| 8 | 5.5% | 6.9% |
| 9 | 10.7% | 11.4% |
| 10 | 7.6% | 7.7% |
| 11 | 8.5% | 10.6% |
Again, let me reinforce…I did NOT use any market share inputs to make these penetration predictions! All I needed was a little linear algebra code in R.
What led me to try this was studying how calculations of “R naught” for contagion modeling are made using something called the “Next Generation Matrix”. Exposed and infected people are part of the infected sub-system and R naught is based on waiting time calculations for how long it takes for infected to leave that state vs. the transmission rate (in flow vs. outflow basically).
Thinking like Markovians. The accuracy of both the share and penetration predictions validate that the Markov math is highly useful for brand analysis. Once we start “thinking like Markovians”, two provocative ideas emerge.
1—if trial happens over time naturally and brand repeat rate is really what drives equilibrium share, should a marketer shift their paid media focus more to driving repeat than on new buyer acquisition?
2—Regarding new brands, BASES-like modeling leads you to plot trial and repeat curves, to see if a new brand is going to make it. If trial eventually happens via random walks, is Markov repeat what really matters for new brand success forecasting? Caveat: just like government administrators wanted to flatten the Covid curve, marketers might want to inflate the trial curve so no one panics.
There is a lot more Markov stuff I want to share, like how Markov approaches can be used for lift testing, but it is too much for one blog. I am submitting a peer reviewed paper with more math (I’ll be sharing as a working paper) and there will be future blogs that will explain more. As always, please provide comments here or e-mail me.
Joel,
Would enjoy reading the working paper. One quick, albeit heuristic, top of mind question is around time series properties? How long a time frame is necessary? Does the data need to account for underlying trends,…, when forecasting from matrix inputs?
Best Regards,
Don Cozine
(640) 203-0626
Hi Don. I’ll send it over if you send me your e-mail. mine is joel@rubinsonpartners.com
the short answer is that the markov matrix is capturing the action between 2 purchases so time is governed by the average purchase cycle.
ttschool.ac.th
The brand prediction powers of the Markov switching matrix | Joel Rubinson on Marketing Research
http://www.ucs.ac.Th
The brand prediction powers of the Markov switching matrix | Joel Rubinson on Marketing Research
gab.com
The brand prediction powers of the Markov switching matrix | Joel Rubinson on Marketing Research