

Caution: you will have a different set of beliefs about what drives advertising effectiveness by the end of this blog!
I think “Wins above replacement” (WAR) is the best stat in sports because it is an incrementality measure…a player’s WAR is an estimate of how many more games his team will win because he is on the team rather than a substitute for the same position. If you add up the WARs of all players on a team, there is a linear formula for predicting team wins.
In the NFL, the difference in WAR of a great quarterback vs. a mediocre one is critical to a team making the playoffs. In baseball, players like Ohtani, Vlad Guerrero, and Aaron Judge deliver 6-10 more wins for their teams than counterparts who just can’t hit or field very well.
As a baseball nut and stat guy, yes, these ideas cross my mind when I think about the business of advertising. Then I thought that applying the WARs idea to advertising might yield a very different picture of what drives advertising effectiveness…and it did!
Consider targeting. If your approach to targeting is WAR based, you will see that there is quite a spread in outcomes from targeting, just as there is a spread between Aaron Judge-like (WAR of 6) vs. Joc Pederson (WAR of 1). If your approach is demo-based, you probably will think targeting adds only a little. Only by considering highest WAR implementations for targeting will you fully value the impact that it can have. The same goes for all the other media components.
Consider the following pie chart from Nielsen/NCS that many are familiar with.
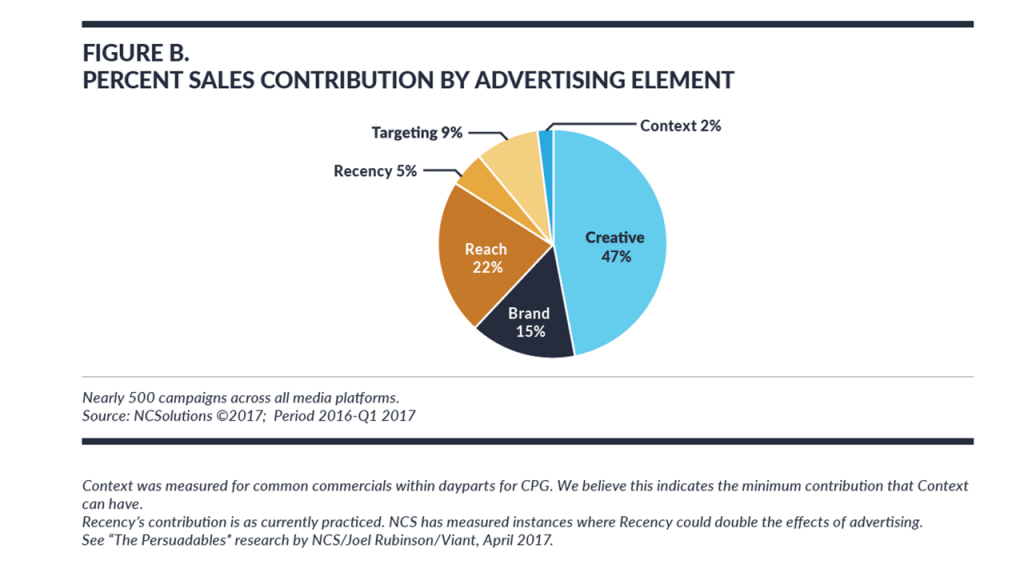
This pie chart is the result of analyzing over 500 campaigns, and shows creative is more important at driving sales lift than media strategy. But is that true? The report actually hedges a bit saying that the role of creative vs. media is dynamic; in fact, they state that media is more important when the creative is not great. However, the whole analysis can be misleading if it reflects low WAR implementations of different media tactics, when high WAR alternatives are readily available.
Let’s take them one at a time…
Targeting. The type of targeting that this study analyzed was okay but not optimal. What was considered to be “on target” was based on impression delivery towards on-target consumers (brand and category buyers). However, the skews were unlikely to be strong and sadly, for a number of campaigns it was thought that targeting non-buyers was “on target”. Actually, non-buyers are highly unlikely to respond to your advertising and targeting them reduces ROAS. Outcomes Based Marketing v2.0 (which I helped to create) demonstrated that a doubling of ad impression delivery to the Movable Middle (five times the ROAS) is possible, and results in a 50% improvement in overall campaign ROAS. High WAR targeting will change how you think about the power of targeting!
Recency. The type of Recency ad delivery that this study referred to…ads delivered close to weekend shopping…was a fairly weak implementation of recency-based planning. In “The Persuadables” white paper (which the Nielsen/NCS study references), I demonstrated how it is possible to programmatically deliver ad impressions to individual consumers timed for when that ID is probabilistically close to an upcoming purchase; we found that “recency ad exposure” doubles ROAS.
Context. This study interpreted “on context” as a match of linear TV daypart to brand. The work of Bill Harvey shows that precise matching of program and brand characteristics, results in 30% ROAS improvement.
Reach. The impact of reach is misrepresented because the yield curve is not monotonic. More reach is better only up to the point where you start sacrificing good targeting principles!
Channel/publisher/ad unit. Not in the Nielsen/NCS document, but needs to be added here. Using Marketing Mix modeling identifies the channels that are working most effectively and efficiently to drive incremental sales. Add in MTA and systematic A/B testing, and you get additional lift from a more granular analysis, e.g., 6 second vs. 15 second video, one publisher vs. another, etc.
Creative. Great creative…the kind that wins an Ogilvy Award (e.g. Lidl and Microsoft Teams in 2021), appears from award submissions to increase business results by about 50%. So great creative can have the same WAR as best-in-class targeting at driving sales response.
Now, let’s suggest WAR values that reflect the above considerations. Even assuming the creative is great we get a very different picture.
| Component | Average practice WAR | Best practice WAR |
| Targeting | 2 | 6 |
| Recency | 1 | 4 |
| Context | 1 | 3 |
| Reach | 2 | 2 |
| Channel/publisher/ad unit | 2 | 3 |
| Brand | 1 | 1 |
| “Best” Creative | 6 | 6 |
| Total advertising WAR | 15 | 25 (+67%) |
Our “average practice WARs” come close to the Nielsen/NCS pie chart; but the true story becomes evident by seeing how much more return a marketer can achieve with best practice/highest WAR implementations.
WAR thinking reveals new insights:
- Best practice media strategy is the main driver of immediate sales response. In “best practice/”high WAR” advertising orchestration, we see that math driven media tactics collectively can be expected to account for 70-75% of ad effectiveness at driving sales…much higher than the 40% that Nielsen/NCS’ analysis of average practices suggests. It isn’t that creative matters less, it’s that media strategies matter much more than Nielsen/NCS reported.
- Best media practice can increase campaign sales response by over 50%. Remember, WARs are additive. In baseball, the formula tells us that twice the WAR means a team goes from below-500 ball to winning 107 games and probably the world series. Here, our best practice WARs add to 67% more than average practice WARs driving considerably higher ROAS.
- Marketers need to get both creative and media strategies right. Although media strategies collectively are the main driver of short-term sales response, that does not negate the importance of great creative which is tied for the highest WAR with targeting.
Having great creative is like a pitcher having their best stuff; it’s easy to win that day. But great pitchers also win when they don’t have their best control, sharpest curve, or fastest fastball that day. Using best in class media tactics means you will win even when you don’t have your best stuff!
Marketing Mix Modeling sucks at measure the value of sports properties and sponsorships as a part of the marketing mix. That is because the metric behind the measurement is mostly tagged advertising spots. If you incorporate measures of “fan engagement” towards the particular sport, you get a very different and usually larger number. Traditional MM models almost always tell you that sponsorships lose money; but if you include fan-engagement metrics, your answer is more likely a positive return.
Nice add Michael, thank you!
http://www.seomarketpros.com
What the Best Metric in Sports Analytics Tells Marketers About Ad Effectiveness | Joel Rubinson on Marketing Research